Wednesday, February 17, 2016

Market follow up Wednesday, February 17, 2016

Two points of yesterday's thesis survived today's price action. The USD hung in at the 97.00 - 96.00 level while oil rallied but stopped short of penetrating its first daily resistance level.

DXY Daily Chart

Oil Daily Chart
SPX Daily Chart
Buyers, as you can see (above) from virtually zero sellers in three strait days of trading, have been extremely sure of themselves. But indexes have to meet a much higher standard, compared to other products, before we can stop selling rallies and start buying dips. In the case of  SPX that "standard" is a weekly close above 2130; a new record high and resumption of the uptrend.

Considering weak economic fundamentals I think such new highs would have to involve QE, another zero interest rate policy, or both. In other words, I don't see how, at peak supply, something like OPEC claiming to curb production is going to push all asset classes into new highs. What are we, a single resource global economy now?

Question or comment below.

Happy trading.

Market Follow Up

The three assets classes featured in Sunday's post (CL, SPX, DXY) performed, at the open, in conjunction with my pre-market thesis. Oil rallied, the  broad market rallied, and the US dollar rallied.

The question, now, is what will decouple to the downside and what will continue upward? In very particular order I expect Oil and US indexes to falter while the USD moves forward. Let's start with the hated "export-killing, way-to-expensive, overvalued" USD.

DXY Daily Chart
Do you see (above) anything..... peculiar about price action of the USD? Something that stands out and makes you ask, "hey, I wonder why price just couldn't wait one more tic to snap upward without even touching any of those perfect-looking daily DXY support levels?"

That's exactly what I thought, and I'm giving the DXY a green light to the 98/99 level, before retesting 95, where we'll assess price action on arrival.

Regarding Oil and the broader market we need to decide if oil is leading or following.

Oil Daily Chart
Following from the looks of price on the above chart; buying momentum on the SPX is greater. Although there is a support level forming (ellipse) below a resistance level (blue rectangle) I am not a  buyer of oil here. In my book two resistance levels in a down-trending market beat one support level. That's not to say price can't break through, but rules are there for a reason.

SPX Daily Chart
Same deal for the SPX. My read, from the above chart, says sellers have the advantage despite yesterday's strong move to the upside. I will look at longs to 2000 and 2060 if the above resistance zones are taken out but not buying into such levels during a downtrend.

Question or  comment below.

Happy trading.

Sunday, February 14, 2016

Markets 16 - 19 Feb 2016

If we're going to, in the context of the market selloff and overall global deleveraging of assets, look for longs at the open of next week's trading session (Monday is a US market holiday), we need to know how much more upside is there in oil.

Oil, after all, is the only green light markets have in an avenue of indicators signaling "bleed."

If you're going to buy anything based on oil, look at buying at the CL 27.60 level but keep in mind you only get one shot. Price rallying to any of the high time frame resistance levels listed on the chart below means 'stop looking for a longs' and be ready to sell at the first sign of price capitulation on a lower time frame chart.

Double dipping levels against a strong trend will transfer your trading capital directly into the account of those on the opposite side of your trades. 


Oil: Weekly Chart

My argument against upside pressure for Oil, beyond 33.00, considers the heft of the selloff, the overall downtrend, and too little shortage of supply. Oh, oil has double bottomed at 26.00? Well, a lot of traders (probably long oil) are mentioning that so let's look at what, exactly, oil double bottomed into.

Oil: Daily Chart with exposed double bottom
 Above we can see the touted double bottom, which has created a trading range between 27.00 and 30.00.
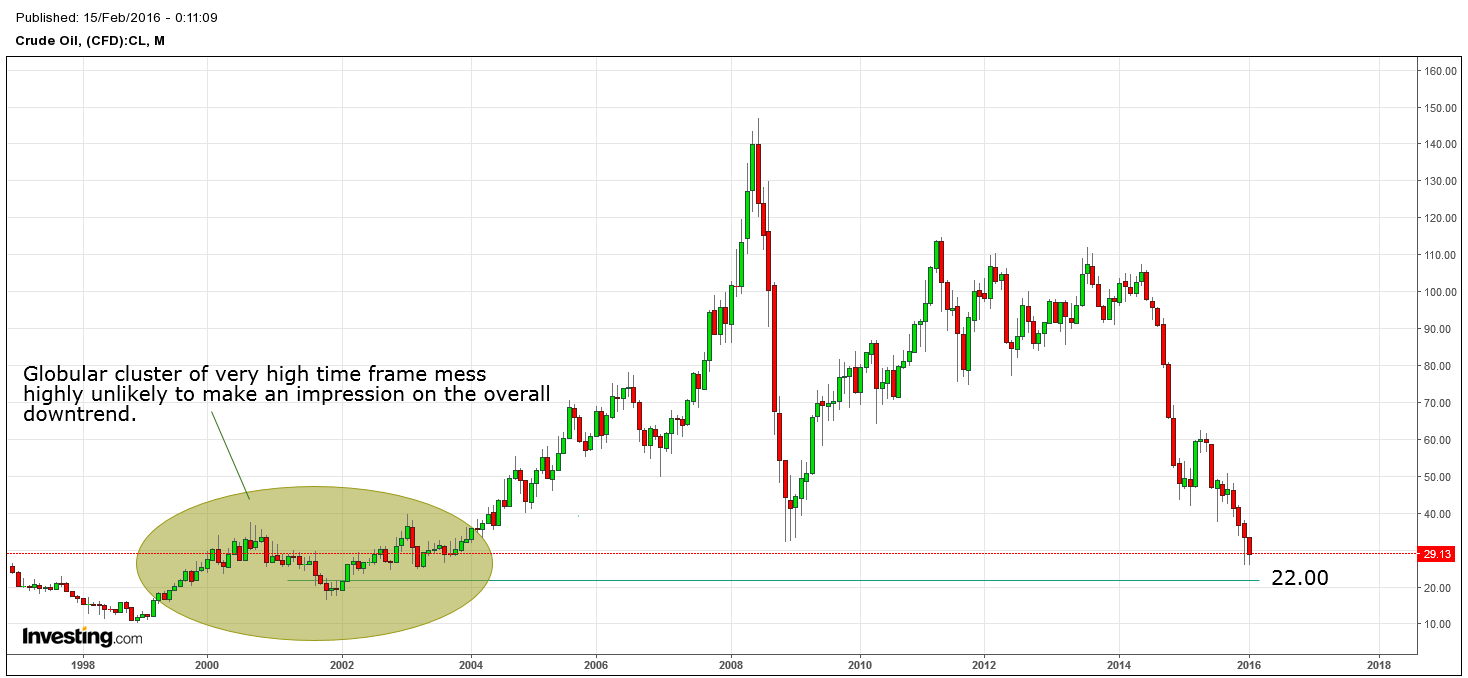
Oil Monthly Chart
On the big daddy monthly chart, however, we see that oil price, converging on 22.00, has not only crushed and refused to rally at the origin of its 2004 breakout, it's pushing into a level where markets took a very long time to decide price should go higher.

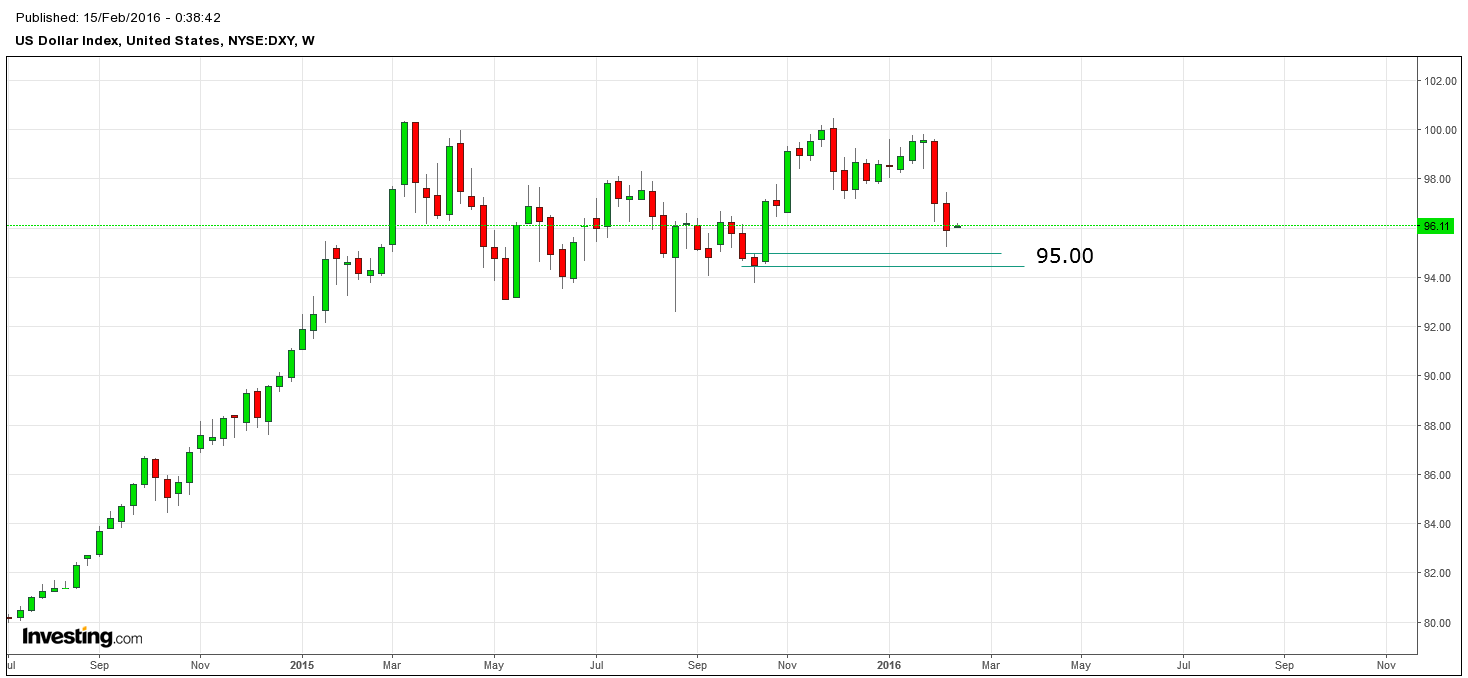
Further evidence that there will be very short term upside gains, if any, in oil is the US dollar where I expect, aside from direct Fed molestation, buyers to give sellers a beating at 95.00.

DXY Weekly Chart. Caveat: dollar upside could depend on Gold, rather than an inverse correlation with stocks. 
I'm not saying 95.00 is going to be Gettysburg for Dollar sellers, but markets likely remember that DXY closed above par in November 2015. That's going to mean something, for greater US dollar upside, and I think 95.00 is the battleground where sellers could lose. Yes, I know I am somewhat contradicting myself considering all the noisy price action to the left, but...

US Ten Year Yield Monthly Chart
unless treasury yields are going to rally here, which is unlikely without Fed intervention (what are they going to do, raise rates?), I don't see further USD downside or oil/stock market upside beyond short buy side trading opportunities into resistance levels to place sell orders in conjunction with the downtrend.

Question or comment below. 

Happy trading.   

Thursday, February 11, 2016

Fed Testimony Aids Selloff

For those who think the Federal Reserve has any idea what it's doing, or think the central bank of disaster has credibility among the economy and markets, yesterday's price action was a meal of your own words.

In a down market, like this one, up moves are opportunities to sell and yesterday's Fed blabber-mouthing by Janet Yellen slammed price into a level of resistance where sell orders filled faster than Hillary Clinton can delete classified emails.

S&P Futures Chart 60M

Sunday, February 7, 2016

Weekly Wrap up 1 - 5 Feb 2016


My technical thesis last week would be green was overcast by deleveraging in every sector associated with the 2013 breakout. Although markets are in an overall downtrend, there was, at the beginning of the week, enough technical evidence to support an up move to SPX 2000 and DJI 17,000.

Remember we are not trading the real economy. If we were there wouldn't be anything to trade. In these markets we are trading the fictitious economy created by Fed inflationary monetary policy and "strong employment numbers" like Obama touted on Friday. Technical analysis is not about trading what you hear or what you know, only what you see. From last Sunday's charts price looked like it had more up than downside potential going into the week.

However, despite some small upside trades on SPX and DJI correlated products my short term "rights" were overshadowed by longer term "wrongs".


From the SPX daily chart (above) we can see how price started Monday, 1 Feb, down then rallied but failed to close above the prior Friday's high suggesting trouble for my "target 2000" premise. The upside, to this otherwise down week, is the floor is still holding at 1875.


Looking at the DOW we can see how it, without the weight of under-performing financials, fared better than the S&P 500 yet, like the SPX, did not manage to place new highs above the previous week's close.


If the NASDAQ is the harbinger of death for bull markets (above) then price aggressively converging on the 4300 level might mean something. This index and the IWM are the worst looking of the majors, Gold and the 30 year bond (price) being mirror opposites.  

The problem for last week's "up" thesis was the real economy, the one were not supposed to hear about, reared it monstrous head exposing asset classes for the paper tiger house of cards they really are.  

Considering the weakness, overall downtrend, and likely impending destruction of price appreciation, I will start next week open to upside trades while  expecting floors on the aforementioned indexes to fail. 

Question and comment below.

Happy trading.

Tuesday, February 2, 2016

Iowa and a rally

Trump will make a solid premeditated comeback in New Hampshire as Cruz begins to face legal questions over his ineligibility to become a US president, under Article 2 of the US Constitution, and SEC campaign finance violations pertaining to his Fed window rate, US Senate loan. Hey, we don't just predict markets around here.

Since I have an actual job that requires me to go out and move stuff around, instead of sitting in front of charts day in and out, I have no idea why markets sold off toady, nor do I care since price has moved into my 'Sunday fallback levels' of  SPX 1894 and DJI 16040.

Never ask why or when markets move. Only be happy they do move and be ready with appropriate buy or sell orders.

Today's sell off should be the end of down pressure for a while, meaning institutions have shaken all the ignorant, squeamish, knee-knocking (you know who you are) players form their fragile branches of market indecision allowing the real rally to begin. What's my proof? Have a look at the DOW and S&P.


What are my supporting indicators, you ask? How about the falling USD and US 10 year? Oh, Oil broke $30 today? Well, that could be an issue, which is why we have to, as professional market speculators, be willing to abandon a non-working thesis and adopt its polar opposite. Markets are not politics, values, history, religion, or culture. If you're wrong, admit it, get the fork out of a bleeding position, and look for the next opportunity.

As for now, however, negative and positive correlating indicators have not turned over. A weak yield and a weak USD directly correlates to rising equities prices. Unless, that is, all of the world's risk assets are tied to falling oil prices. Then we'll have a much lower than expected market for a much longer than expected amount of time.

Happy trading.

Monday, February 1, 2016

Monday 1 Feb 2016: The continuing decline of oil

 
Yesterday's forecast of an up trending US market played out from the NY open. Hopefully the information was useful in judging long entries on your SPX and DJI correlated products.

Today oil seemed to, again, be the headline suspect preventing markets from resuming a Fed-fueled destiny with never ending record highs. But what exactly is going on with oil? Will it go lower?

A lot of experts say yes but those people are just chiming in after hearing someone they assume knows what they are talking about repeat it from someone they assume smarter than themselves. After all, how hard is it to say a falling markets will go down and rising markets will go up? You only have to be right once.

Instead of trying to figure out the future price of oil with global supply vs demand or OPEC production quotas and the Saudi welfare state, let's look at the technical argument for lower oil. 

We can see from the above monthly chart how oil price, after returning to the origin of its May 2004 breakout (green arrow) in December 2008, failed to make a new high, topping out at $114 a barrel in April 2011, only to start selling off in July 2014 after a three year consolidation period.

Unable to place above $140 after a retracement to origin of its May 2004 breakout, the technicals were determinate that oil's record run had come to an end. This is what the death of a globally significant, highly manipulated, and intentionally inflated commodity looks like.

So if your uncle is telling you that "now" is the time to buy his broker's favorite oil ETF I can guarantee that (barring a global cataclysmic event) you will be catching a falling knife and had better wait until the $22 - $14 level before loading up on any longs correlated to crude oil markets.

Happy trading.